
A local SEO dashboard turns scattered search data into a clear view of what is helping customers find and contact your business. Without one, you may spend hours comparing Google Business Profile, Analytics, and Search Console numbers that don't line up.
A local SEO dashboard gives you one place to track visibility, website activity, calls, directions, and leads. The goal isn't to fill a report with charts. The goal is to know what changed, why it changed, and what to improve next.
What a local SEO dashboard should answer
A useful dashboard should answer business questions, not only report marketing activity.
You need to know whether people are finding your business, what they do after finding it, and which locations or services are producing results. A high number of profile views is helpful, but it doesn't tell the whole story. Calls, website visits, direction requests, form submissions, and booked appointments usually matter more.
We recommend organizing the report around three levels:
- Visibility shows whether people see your business in local search.
- Engagement shows what they do after seeing your profile or website.
- Business outcomes show whether that activity creates leads or customers.
The right metrics depend on the data sources available to your business. Use a simple source map before building charts.
| Data source | Useful metrics | Main question |
|---|---|---|
| Google Business Profile | Profile views, calls, website clicks, directions, messages | Are local searchers taking action? |
| Google Analytics 4 | Sessions, key events, landing pages, phone clicks | What happens on the website? |
| Google Search Console | Queries, clicks, impressions, CTR, position | Which searches and pages earn visibility? |
| Lead or booking system | Leads, appointments, sales value | Are marketing visits becoming business? |
| Rank tracker | Local rankings by keyword and location | Where do target terms appear? |
Not every connector provides every Google Business Profile field. Treat the connector's available fields as a boundary, not a suggestion. If local ranking data isn't available, don't create a chart that implies you are measuring rankings.
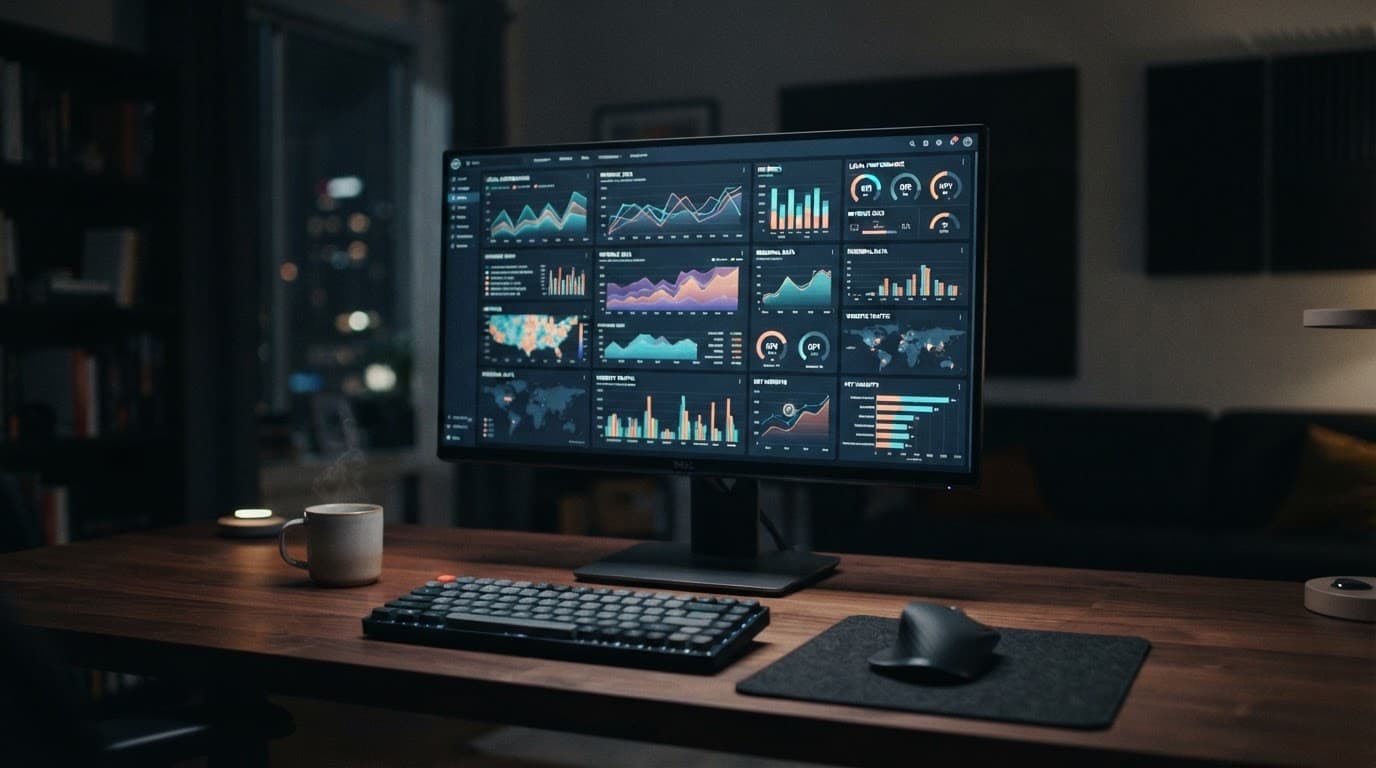
Keep the first version focused. A report with six useful charts is easier to trust than one with thirty charts nobody reviews.
Choose the right data sources and connector setup
Looker Studio connects directly to several Google data sources, including Google Analytics 4, Google Search Console, Google Sheets, and Google Ads. Google Business Profile is different.
As of 2026, Google Business Profile data in Looker Studio generally requires a third-party connector or an intermediate source such as Google Sheets. Google has not provided a native Google Business Profile connector in the normal Looker Studio workflow. Many connector products still call the source "Google My Business," which is the older name for Google Business Profile.
Your setup will usually include these steps:
- Open the Looker Studio report and select Add data.
- Choose a Google Business Profile connector from a third-party provider, if direct profile reporting is needed.
- Authorize the Google account that has access to the relevant profiles.
- Select the business group, location, or locations you want to report.
- Choose the available fields and date range.
- Add the source to the report and confirm that the records load correctly.
The exact screens vary by provider. For example, Porter Metrics' Google Business Profile setup guide describes a direct connector workflow with account authorization and location selection. Coupler.io's Google Business Profile integration uses a connection and data-organization process before loading the data into Looker Studio.
Before selecting a connector, check four things:
- Whether it supports one location or multiple locations.
- Which profile actions and dimensions it exposes.
- How often the data refreshes.
- Whether the plan includes the number of accounts, locations, and refreshes you need.
Some connectors use a direct source inside Looker Studio. Others send data through their own platform or Google Sheets. Both approaches can work, but they have different refresh limits and maintenance needs. A Google Sheets workflow may be easier to inspect, while a direct connector may reduce manual steps.
You also need a clean source for website activity. Connect GA4 separately rather than assuming Business Profile data includes website behavior. If you want to identify visits from a profile link, use consistent UTM parameters in the website URL attached to the profile. Don't label all direct traffic as Google Business Profile traffic. Direct traffic includes many visits that GA4 can't identify.
Search Console should also remain a separate source. It reports search visibility for your website, not every action taken on your Business Profile. That distinction prevents confusing profile impressions with organic website impressions.
Build the dashboard page by page
A local SEO dashboard works best when each page has one clear job. Start with the summary, then give readers the detail they need to investigate changes.
Start with an executive summary
The first page should help a business owner understand the reporting period in less than a minute.
Use scorecards for:
- Google Business Profile calls
- Website clicks from the profile
- Direction requests
- Organic clicks
- Organic key events
- Total qualified leads
Add a date control and a comparison to the previous period. Monthly comparisons are useful for established businesses, while a 28-day comparison can reduce the effect of different month lengths.
A scorecard should include the current value and a clear comparison. Avoid placing ten scorecards across the top. Choose the metrics connected to real decisions.
A line chart can show weekly trends for calls, website clicks, and organic key events. A small table can show the top locations or landing pages. The first page should quickly answer whether performance improved, declined, or stayed flat.
If you report for several businesses, add a business or location filter. If the report covers one company, use that space for a service filter instead.
Give Google Business Profile its own page
The profile page should show what searchers did after finding the listing.
Useful charts include:
- Profile actions by week
- Calls and direction requests by location
- Website clicks by location
- Profile activity by device, if the connector provides it
- Review count, rating, and unanswered reviews, if review data is available
- A location table with the current period, previous period, and percentage change
Use a table for multi-location reporting. Include the location name, profile views if available, calls, direction requests, website clicks, and total actions. Sort by the metric the business cares about most.
The report should also separate branded and non-branded information when the data supports it. Search Console can show query patterns for the website, but it doesn't provide every query that caused a profile to appear. Don't present Search Console query data as a complete list of Google Business Profile searches.
A connector's field names may use terms such as impressions, searches, views, or interactions. Read the provider's field definitions before naming a chart. A chart labeled "map views" creates a different expectation than one labeled "profile impressions."
Connect website behavior to local visibility
The website page connects search activity to actions on the site.
Use GA4 dimensions and metrics such as:
- Landing page
- Session source and medium
- Sessions
- Engaged sessions
- Engagement rate
- Key events
- Phone link clicks
- Form submissions
- Appointment or booking events
Create a page-level table for local service pages. A plumbing company might compare /emergency-plumbing/, /water-heater-repair/, and /drain-cleaning/. A dental practice might compare service pages by treatment and location.
The page should answer a practical question: which pages attract visitors and which pages produce inquiries?
If the business tracks phone clicks as a GA4 key event, include them beside form submissions. If calls are recorded in a separate system, connect that source only after the website data has been validated. A phone click is not the same as a completed phone conversation.
Use Search Console for search demand
The Search Console page should focus on queries, pages, and search performance.
Add a table with:
- Query
- Landing page
- Clicks
- Impressions
- Click-through rate
- Average position
Add filters for device and search type when they help answer a question. A query filter can isolate local phrases such as "roof repair near me" or "family dentist in Dayton."
Average position is useful for spotting movement, but it isn't a precise local ranking report. Search Console averages data across users, locations, devices, and search results. For location-specific rankings, connect a rank tracker that records the search location and keyword.
A useful chart compares impressions and clicks over time. Rising impressions with flat clicks may point to weak title tags, search intent mismatch, or stronger competitors in the results. Falling impressions may point to a content, technical, or demand problem.

Keep page names and query labels readable. Long URLs can make a dashboard hard to scan, so use a calculated field that extracts the path or create a cleaner page-name mapping in the source.
Add calculated fields that answer real questions
Calculated fields help turn raw totals into useful rates. Use them carefully, because a good formula can still produce a misleading result when the source data is incomplete.
Calculate click-through rate correctly
For Search Console data, click-through rate is clicks divided by impressions.
Use logic similar to:
CASE WHEN SUM(Impressions) = 0 THEN 0 ELSE SUM(Clicks) / SUM(Impressions) END
Format the result as a percentage.
Use the ratio of totals instead of averaging row-level CTR values. If one query has ten impressions and another has 10,000, both shouldn't have the same influence on the overall rate.
Measure profile action rate
If the connector provides profile views and calls, you can calculate a call rate:
CASE WHEN SUM(Profile views) = 0 THEN 0 ELSE SUM(Calls) / SUM(Profile views) END
You can use the same pattern for direction requests or website clicks. The exact field names may differ, so replace them with the names in your source.
Call this a profile action rate, not a conversion rate, unless the denominator and outcome are clearly defined. A person may call without becoming a customer.
Track change without hiding zero values
A percentage change field can be useful for location tables, but zero values need special handling. A location with no previous-period calls can't have a meaningful percentage increase.
Use conditional logic such as:
CASE WHEN Previous period = 0 THEN NULL ELSE (Current period - Previous period) / Previous period END
When Looker Studio's built-in date comparison supplies the comparison, use its native comparison display instead of forcing a custom previous-period field. Custom blended comparisons require more testing because the two date ranges can join incorrectly.
Create practical labels
You can create labels that help a reader scan a table. For example:
CASE WHEN Clicks = 0 AND Impressions > 0 THEN "Impressions without clicks" ELSE "Has clicks" END
Keep labels factual. Don't create labels such as "high performing" unless you define the threshold. A label should help someone find the next issue, not replace the analysis.
Place calculated fields at the chart level when they are only needed in one chart. Use a data-source field when the same calculation appears throughout the report. This keeps the shared source easier to manage.
Make filters and comparisons easy to use
Filters are helpful when they reduce the time needed to investigate a change. They become a problem when every chart has a different filter and nobody knows which view is active.
Start with three controls:
- Date range
- Location
- Service or landing page
Add device or traffic source only when the data supports a real decision. A report for one local business may not need a location filter. A report for 40 branches probably needs one on every main page.
Use consistent date settings across sources. If GA4 uses one reporting period and Search Console uses another, the comparison can look accurate while describing different days.
Cross-filtering can let a reader click a location or service and update other charts. Test it before sharing. Blended sources may not respond in the same way as charts connected to a single source.
Set a useful default date range. The last 28 or 30 days works for regular monitoring, while a longer range helps identify seasonal changes. Include a comparison period when the report is used for recurring client or management meetings.
A clean dashboard should make the next question obvious. If a scorecard drops, the user should be able to filter by location, page, or channel without opening a separate spreadsheet.
Automate and validate the reporting data
Automation saves time, but it doesn't remove the need for checks. Connectors can lose authorization, fields can change, and a report can continue displaying old data without making the problem obvious.
Review the connector's refresh schedule before calling the dashboard live. Some providers offer different refresh limits by plan. A report that refreshes once per day may be enough for monthly SEO work. It isn't the right fit for hourly campaign monitoring.
Give the source a clear name, such as GBP - All Locations or GA4 - Main Website. Keep one source for a group of locations when the connector supports it. Multiple copies of the same source make filters and maintenance harder.
Decide who owns the credentials. If a report depends on one person's account, access can break when that person leaves the company or changes permissions. Use an account with stable business access, and make sure the account can view every required profile.
Before sharing the report, run this validation checklist:
- Confirm the selected date range and time zone.
- Compare the latest profile totals with the source platform.
- Check that every expected location appears once.
- Look for duplicate rows after adding a connector or blend.
- Confirm that blank values aren't being counted as zero.
- Test each location, service, and date filter.
- Compare GA4 key events with the website's actual test submissions or phone links.
- Check Search Console clicks and impressions against the selected property.
- Review the report as a viewer, not only as an editor.
- Confirm that shared viewers have the access required by each data source.
Use a test conversion before relying on website lead metrics. Submit a form, click a phone link, or complete a booking test according to the site's tracking setup. Don't assume that a chart labeled "leads" is recording real leads until the event has been checked.
For larger reporting systems, a provider such as Supermetrics' Google Business Profile integration may be worth comparing with other connector options. A direct connector, a scheduled spreadsheet, and a paid data pipeline each have different costs and maintenance requirements.
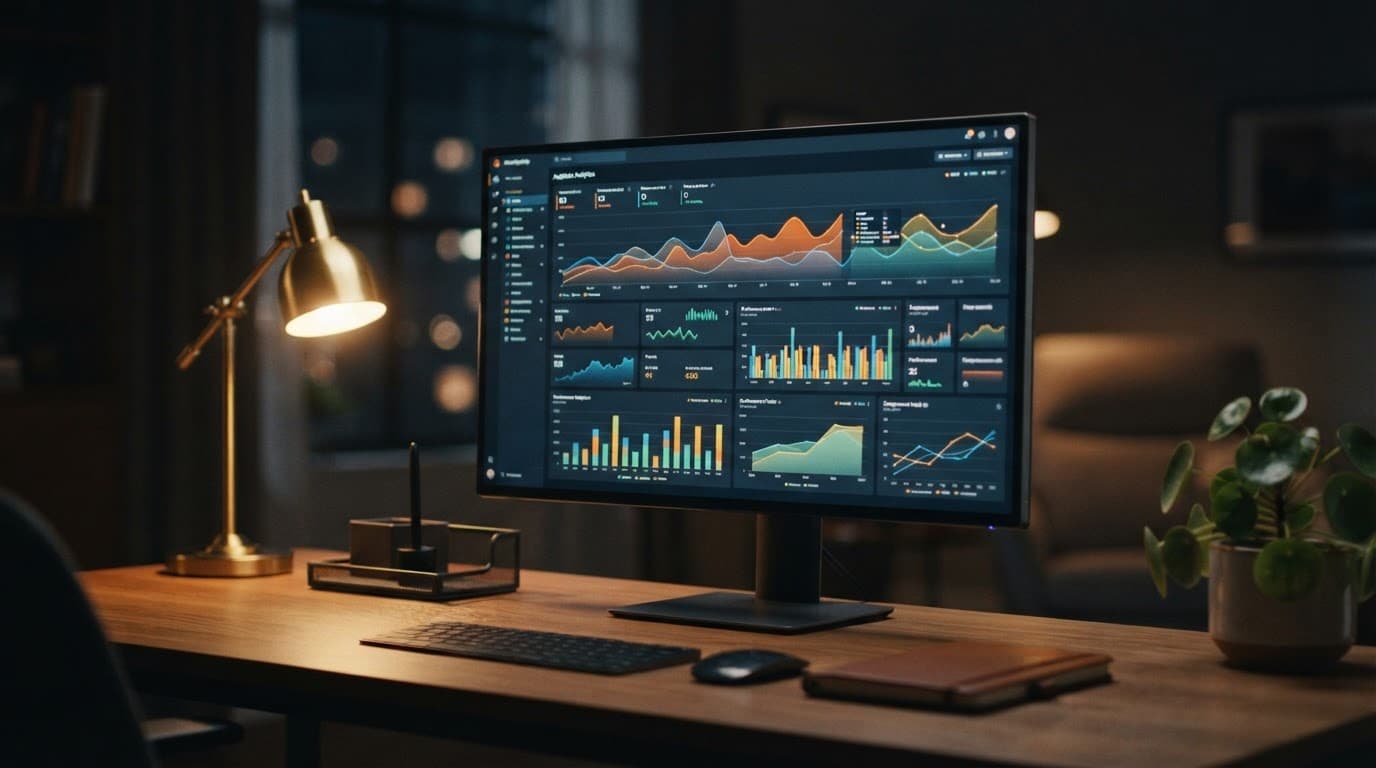
Don't share a dashboard until the numbers pass a manual check. A polished report with stale or duplicated data can lead to worse decisions than no report.
Turn dashboard findings into local SEO actions
A dashboard is useful when it changes what you do next.
Suppose profile views rise, but calls and website clicks fall. Check the business category, services, photos, reviews, and the profile's primary action path. Then review the page visitors reach. A page that loads slowly or makes the phone number hard to find can waste useful visibility.
If calls rise while website sessions stay flat, the profile may be doing its job without sending people to the site. Review call quality and missed calls before changing the website. More traffic isn't always the answer.
If Search Console impressions rise for a service page but clicks remain low, review the page title and description. Make the service and service area clear. If clicks rise but key events remain low, inspect the page content, form, phone visibility, and trust signals.
For multi-location businesses, compare locations with similar services and market conditions. One branch may have better visibility because its profile is complete, its reviews are current, or its local page matches the searcher's needs more closely.
Use DataBloo's Google Business Profile connector information when comparing how third-party tools expose profile data. The important question is not which dashboard looks busiest. It's whether the available fields support a decision you can act on.
Conclusion
A local SEO dashboard in Looker Studio should bring profile activity, website behavior, search visibility, and leads into one reliable view. Start with a small set of business-focused metrics, connect each source carefully, and use calculated fields only when their definitions are clear.
The strongest report isn't the one with the most charts. It's the one that helps you spot a change, verify the data, and choose the next local SEO task with confidence.